When looking at company financials it is 80% the income statement, 10% the balance sheet, and 10% the cash flow statement. Going even further there are 12 or so data points that are the most important when evaluating the company from an investment perspective. As an analyst I would need these numbers quickly in order to get a good understanding of how a company is performing or if they fit into my comps set.
This project is the extension of the public company highlights project I worked on beforehand, which allowed us to go deeper into the flow of how customers use financial data on the PitchBook platform. For this project I was the only product designer and worked closely with my product manager to get this project completed.
PITCHBOOK DATA
4 Months
Sketch
Invision
Miro
"Financials on your site is just a wall of data, it's hard to find what I need quickly"
We have constantly gotten feedback from our users who have switched over from our competitors, CapIQ, that our financial data is hard to read and just a wall of data. We needed to find a way to give users the data they needed in a more refined way.
To start this project I dove deep into the world of company financials and learned what data points are the most important when looking at company financials and what ways of viewing financials is most common.
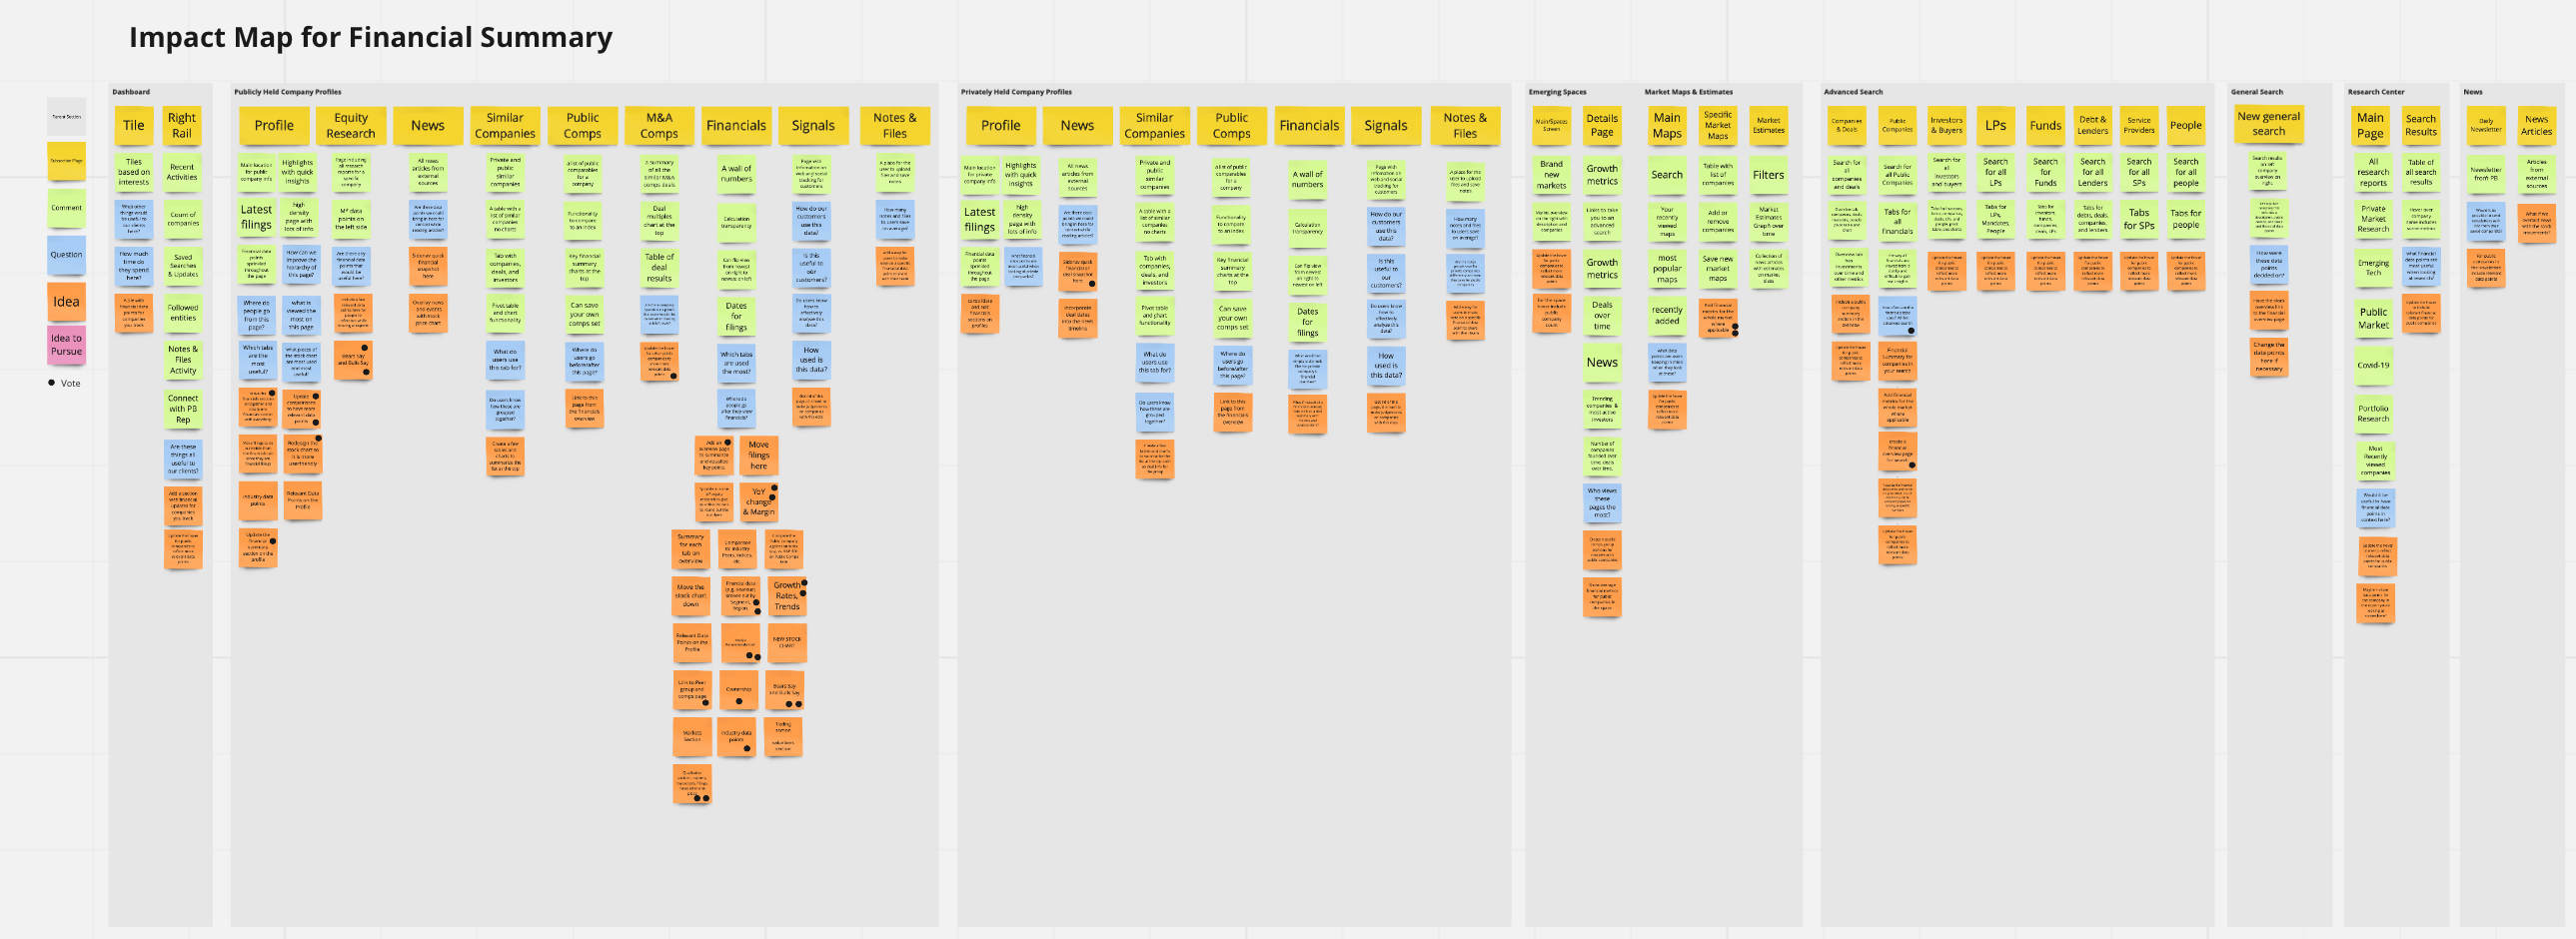
I created an impact map to look at financials on the PitchBook platform on a whole system level, where are financials used and where are they displayed? How can we improve them? What areas should we focus on? After doing this my PM and I narrowed down this project into three phases
Phase 1 - Update the financials section on a company profile
Phase 2 - Update the Key Metrics section within the financials tab on a company profile
Phase 3 - Update financials on Public Company search
After reviewing our phases with stakeholders and management we decided to focus on phases 1 & 2 for this project and work on phase 3 later when we had more developers available.
Post research we needed to narrow down which data points should be shown.
Originally our list included roughly 60 data points, when reviewing with stakeholders we were encouraged to narrow it down even more. From there we narrowed it down to the 13 most important data points.
This is the starting designs for the Key Metrics tab that was on the PitchBook platform before we updated it.
This is the updated view I created for the Key Metrics Tab. It included only the most important information, sparklines for quicker understanding, different views to see how a company is doing year over year or quarter over quarter.
To see the chart at a deeper level you can hover and click on the sparkline.
For the other financials tabs such as income statement, balance sheet, and cash flows we wanted to add some more functionality to make viewing easier for users.
This included:
- adding new views to view data as year over year growth, as an absolute number, or as a percentage of revenue.
- changing negative numbers to be red
This was the previous view for financials on a company profile. It was at the bottom of the page and was a wall of information and an overload of data.
The new profile financials section narrows down the amount of data points to only the most relevant ones and in addition shows segment data to customers can quickly see what revenue streams are driving a specific business.
In addition to the design changes to the profile financials we moved the financials up in the hierarchy of the profile page since financials are one of the first things customers go to when viewing profiles.
In the 6 months following the release of this project:
- Views of the Financials Tab increased 27.44%, with unique users increasing 47.09%
- Adoption of public company financials increased 10.55%
- Adoption of clicking into the charts/numbers increased 37.02%
- Clicks to financials on the profile increased 46.03%


.jpg)
.jpg)


